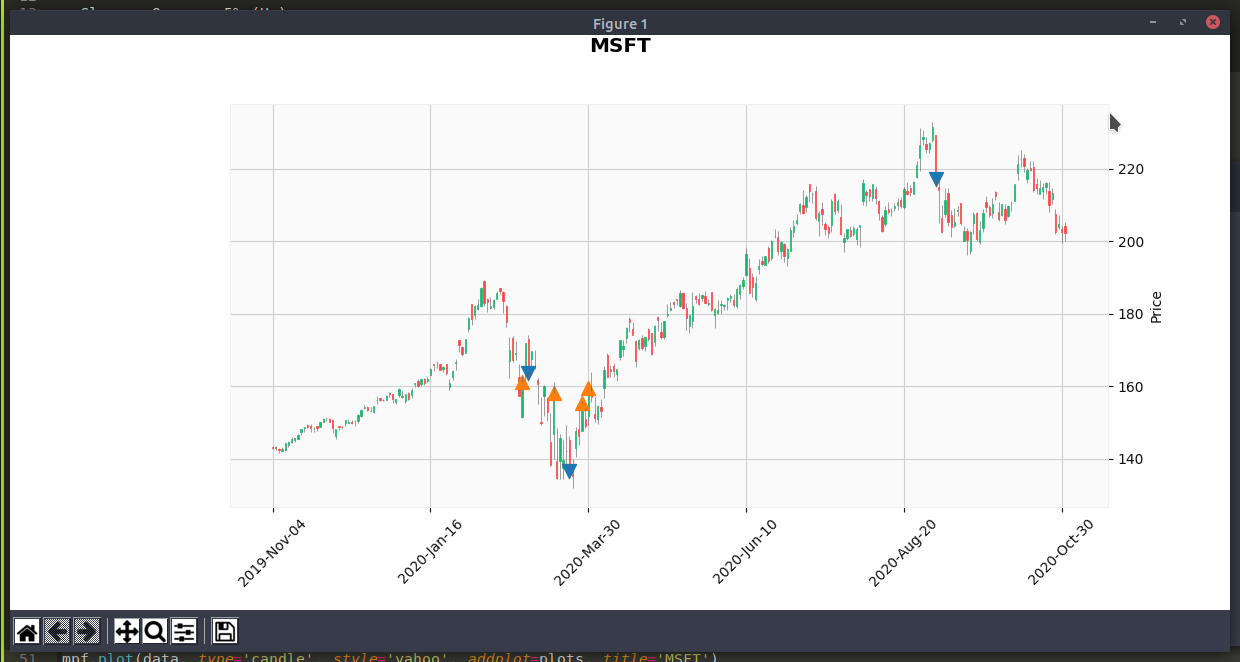
We shall plot a marker on the price chart on the following conditions
- Close - Open >= 5% (Up)
- Open - Close >= 5% (Down)
import yfinance as yfimport mplfinance as mpfimport numpy as npyticker = yf.Ticker("MSFT")data = yticker.history(period="1y") # max, 1y, 3mo, etcdef detect_intraday_price_diff(data): up_markers = [] down_markers = [] for index, row in data.iterrows(): diff = row['Open'] - row['Close'] diff_pct = diff / row['Open'] if diff_pct >= 0.05: up_markers.append(row['Close']) down_markers.append(np.nan) elif diff_pct <= -0.05: down_markers.append(row['Close']) up_markers.append(np.nan) else: up_markers.append(np.nan) down_markers.append(np.nan) return up_markers, down_markers up_markers, down_markers = detect_intraday_price_diff(data)up_plot = mpf.make_addplot(up_markers, type='scatter', marker='v', markersize=100, panel=0)down_plot = mpf.make_addplot(down_markers, type='scatter', marker='^', markersize=100, panel=0)plots = [up_plot, down_plot]mpf.plot(data, type='candle', style='yahoo', addplot=plots, title='MSFT')