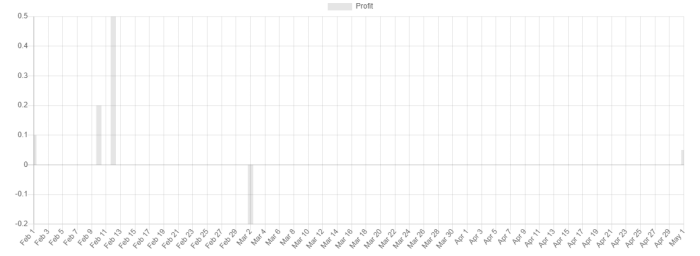
<template> <div> <bar-chart :chart-data="barChartData" :options="barChartOptions" :width="800" :height="300" /> </div></template><script>export default { data() { return { barChartData: { datasets: [ { label: 'Profit', data: [0.1, 0.2, 0.5, -0.2, 0.05] } ], labels: [new Date(2020, 1, 1), new Date(2020, 1, 10), new Date(2020, 1, 12), new Date(2020, 2, 2), new Date(2020, 4, 1)] }, barChartOptions: { tooltips: { }, scales: { xAxes: [ { type: 'time', // barThickness: 6, // distribution: 'series', /* time: { displayFormats: { 'minute': 'MMM DD h:mm', 'hour': 'MMM DD hA', 'day': 'MMM DD', 'week': 'MMM DD', 'month': 'MMM DD', 'quarter': 'MMM DD', 'year': 'MMM DD', } }, */ /* ticks: { callback: (value) => { console.log(value, this.formatDateTime(value)) return this.formatDateTime(value) }, } */ } ], } } } }, methods: { formatDateTime(date) { if (!date) return 'NA' const options = { year: 'numeric', month: 'short', day: 'numeric', hour: '2-digit', minute: '2-digit' } return date.toLocaleString(undefined, options) }, }}</script>
❤️ Is this article helpful?
Buy me a coffee ☕ or support my work via PayPal to keep this space 🖖 and ad-free.
Do send some 💖 to @d_luaz or share this article.
✨ By Desmond Lua
A dream boy who enjoys making apps, travelling and making youtube videos. Follow me on @d_luaz
👶 Apps I built
Travelopy - discover travel places in Malaysia, Singapore, Taiwan, Japan.