Note
- Use MACD signal only: Buy when Signal line cross above MACD line (Postive Histogram), Sell when Signal line cross below MACD line (Negative Histogram)
- Plot candle chart and MACD chart for better visualization
- Plot buy and sell points on the chart
- Print buy/sell transactions and profit/loss
- Meassure performance
NOTE: The Best Times to Use the MACD Indicator
Code
Install libraries
pip install yfinancepip install mplfinanceRefer Install Python TA-Lib (Ubuntu)
import yfinance as yfimport mplfinance as mpfimport talib as taimport numpy as npimport pandas as pdimport mathticker_name = 'MSFT'yticker = yf.Ticker(ticker_name)data = yticker.history(period="1y") # max, 1y, 3mo# macddata["macd"], data["macd_signal"], data["macd_hist"] = ta.MACD(data['Close'])# plot macdmacd_plot = mpf.make_addplot(data["macd"], panel=1, color='fuchsia', title="MACD")colors = ['g' if v >= 0 else 'r' for v in data["macd_hist"]]macd_hist_plot = mpf.make_addplot(data["macd_hist"], type='bar', panel=1, color=colors) # color='dimgray'macd_signal_plot = mpf.make_addplot(data["macd_signal"], panel=1, color='b')# buy/sellbuy_signals, sell_signals, signals = detect_macd_signals(data)# plot buy/sellbuy_plot = mpf.make_addplot(buy_signals, type='scatter', marker='v', markersize=100, panel=0)sell_plot = mpf.make_addplot(sell_signals, type='scatter', marker='^', markersize=100, panel=0)# print buy/sell transaction and statsprint_performance_summary(signals)# plot candle chart and allplots = [macd_plot, macd_signal_plot, macd_hist_plot, buy_plot, sell_plot]mpf.plot(data, type='candle', style='yahoo', addplot=plots, title=f"\n{ticker_name}", ylabel='')def detect_macd_signals(data): """Use MACD cross-over to decide buy/sell Args: data: panda DataFrame with OHLC with MACD data Return: buy_signals, sell_signals: for chart plot signals: buy/sell transaction for summary printing """ buy_signals = [np.nan] sell_signals = [np.nan] signals = [] last_signal = None for i in range(1, len(data)): if data['macd_hist'][i-1] < 0 and data['macd_hist'][i] > 0: price = (data['Open'][i] + data['Close'][i]) / 2 buy_signals.append(price) last_signal = 'buy' signals.append({ 'date': data.index[i], 'action': 'buy', 'price': price }) sell_signals.append(np.nan) elif data['macd_hist'][i-1] > 0 and data['macd_hist'][i] < 0 and last_signal == 'buy': price = (data['Open'][i] + data['Close'][i]) / 2 sell_signals.append(price) last_signal = 'sell' signals.append({ 'date': data.index[i], 'action': 'sell', 'price': price }) buy_signals.append(np.nan) else: buy_signals.append(np.nan) sell_signals.append(np.nan) return buy_signals, sell_signals, signalsdef print_performance_summary(signals): """Print buy/sell transactions and statistics Args: signals: recorded buy/sell transactions """ pairs = zip(*[iter(signals)]*2) rows = [] profit_count = 0 profit_pct_avg = 0 for (buy, sell) in pairs: profit = sell['price'] - buy['price'] profit_pct = profit / buy['price'] if profit > 0: profit_count += 1 profit_pct_avg += profit_pct row = { 'buy_date': buy['date'], 'duration': (sell['date'] - buy['date']).days, 'profit': profit, 'profit_pct': "{0:.2%}".format(profit_pct) } rows.append(row) df = pd.DataFrame(rows, columns=['buy_date', 'duration', 'profit', 'profit_pct']) with pd.option_context('display.max_rows', None, 'display.max_columns', None): print(df) total_transaction = math.floor(len(signals) / 2) stats = { 'total_transaction': total_transaction, 'profit_rate': "{0:.2%}".format(profit_count / total_transaction), 'avg_profit_per_transaction': "{0:.2%}".format(profit_pct_avg / total_transaction) } for key, value in stats.items(): print('{0:30} {1}'.format(key, value))Result
Output of print_performance_summary for MSFT
- We manage to do 8 pairs of trade (buy/sell) in 1 year
- 5/8 (62.50%) trades are profitable
- Average profit per trade is 3.89%, with most profitable trade making 18.98%, while the worst lost -3.96%.
    buy_date  duration     profit profit_pct
0 2020-01-09        18  -0.248023     -0.15%
1 2020-01-30        22   7.896236      4.59%
2 2020-03-26        48  28.745260     18.98%
3 2020-06-09         6  -2.134837     -1.13%
4 2020-06-16        29  15.532458      8.06%
5 2020-08-04         7  -8.439593     -3.96%
6 2020-08-20        15   2.615005      1.23%
7 2020-09-29        24   7.324997      3.52%

total_transaction               8
profit_rate                     62.50%
avg_profit_per_transaction      3.89%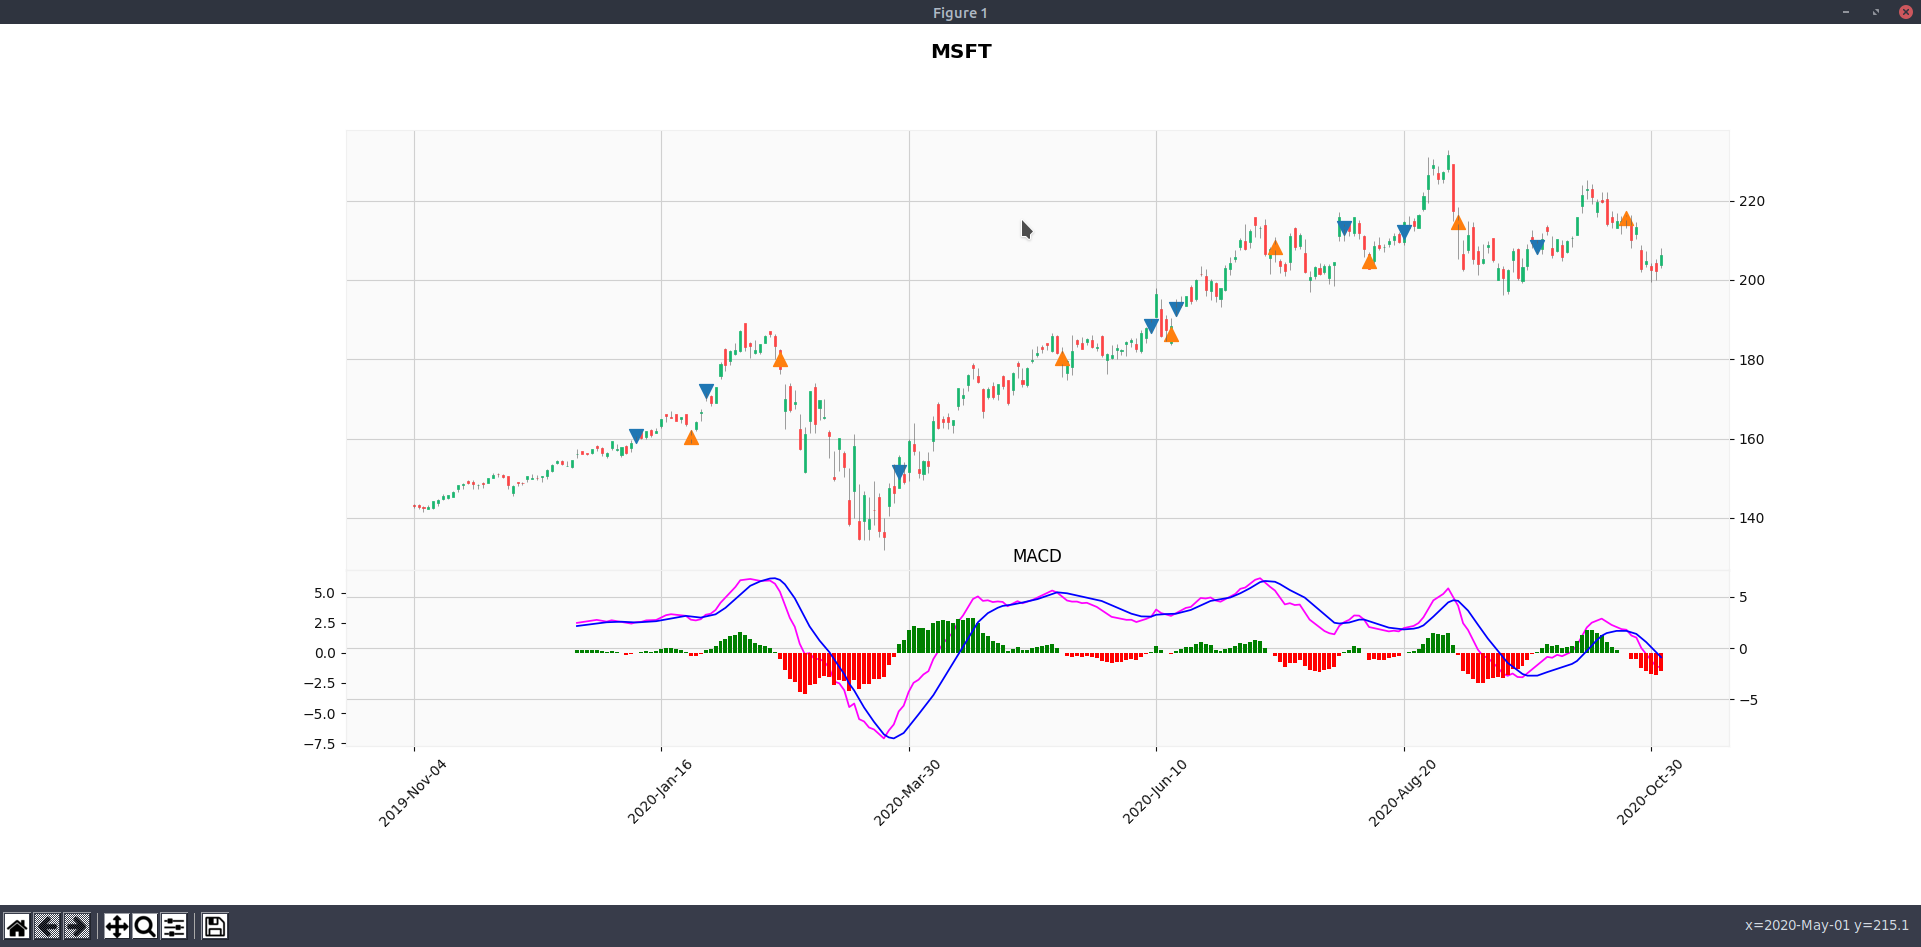
What's Next
- We assume the cross-over of MACD and Signal line is the buy/sell trigger. We could run more tests to determine whether delaying N day after cross-over would yield better result.
- Maybe we want to consider the weightage if the signal line is above 0 or below 0.
- We should test with more stocks, either S&P 500 or NASDAQ 100.
- We should experiment of using MACD together with other signals, such as SMA or Stochastic/RSI.